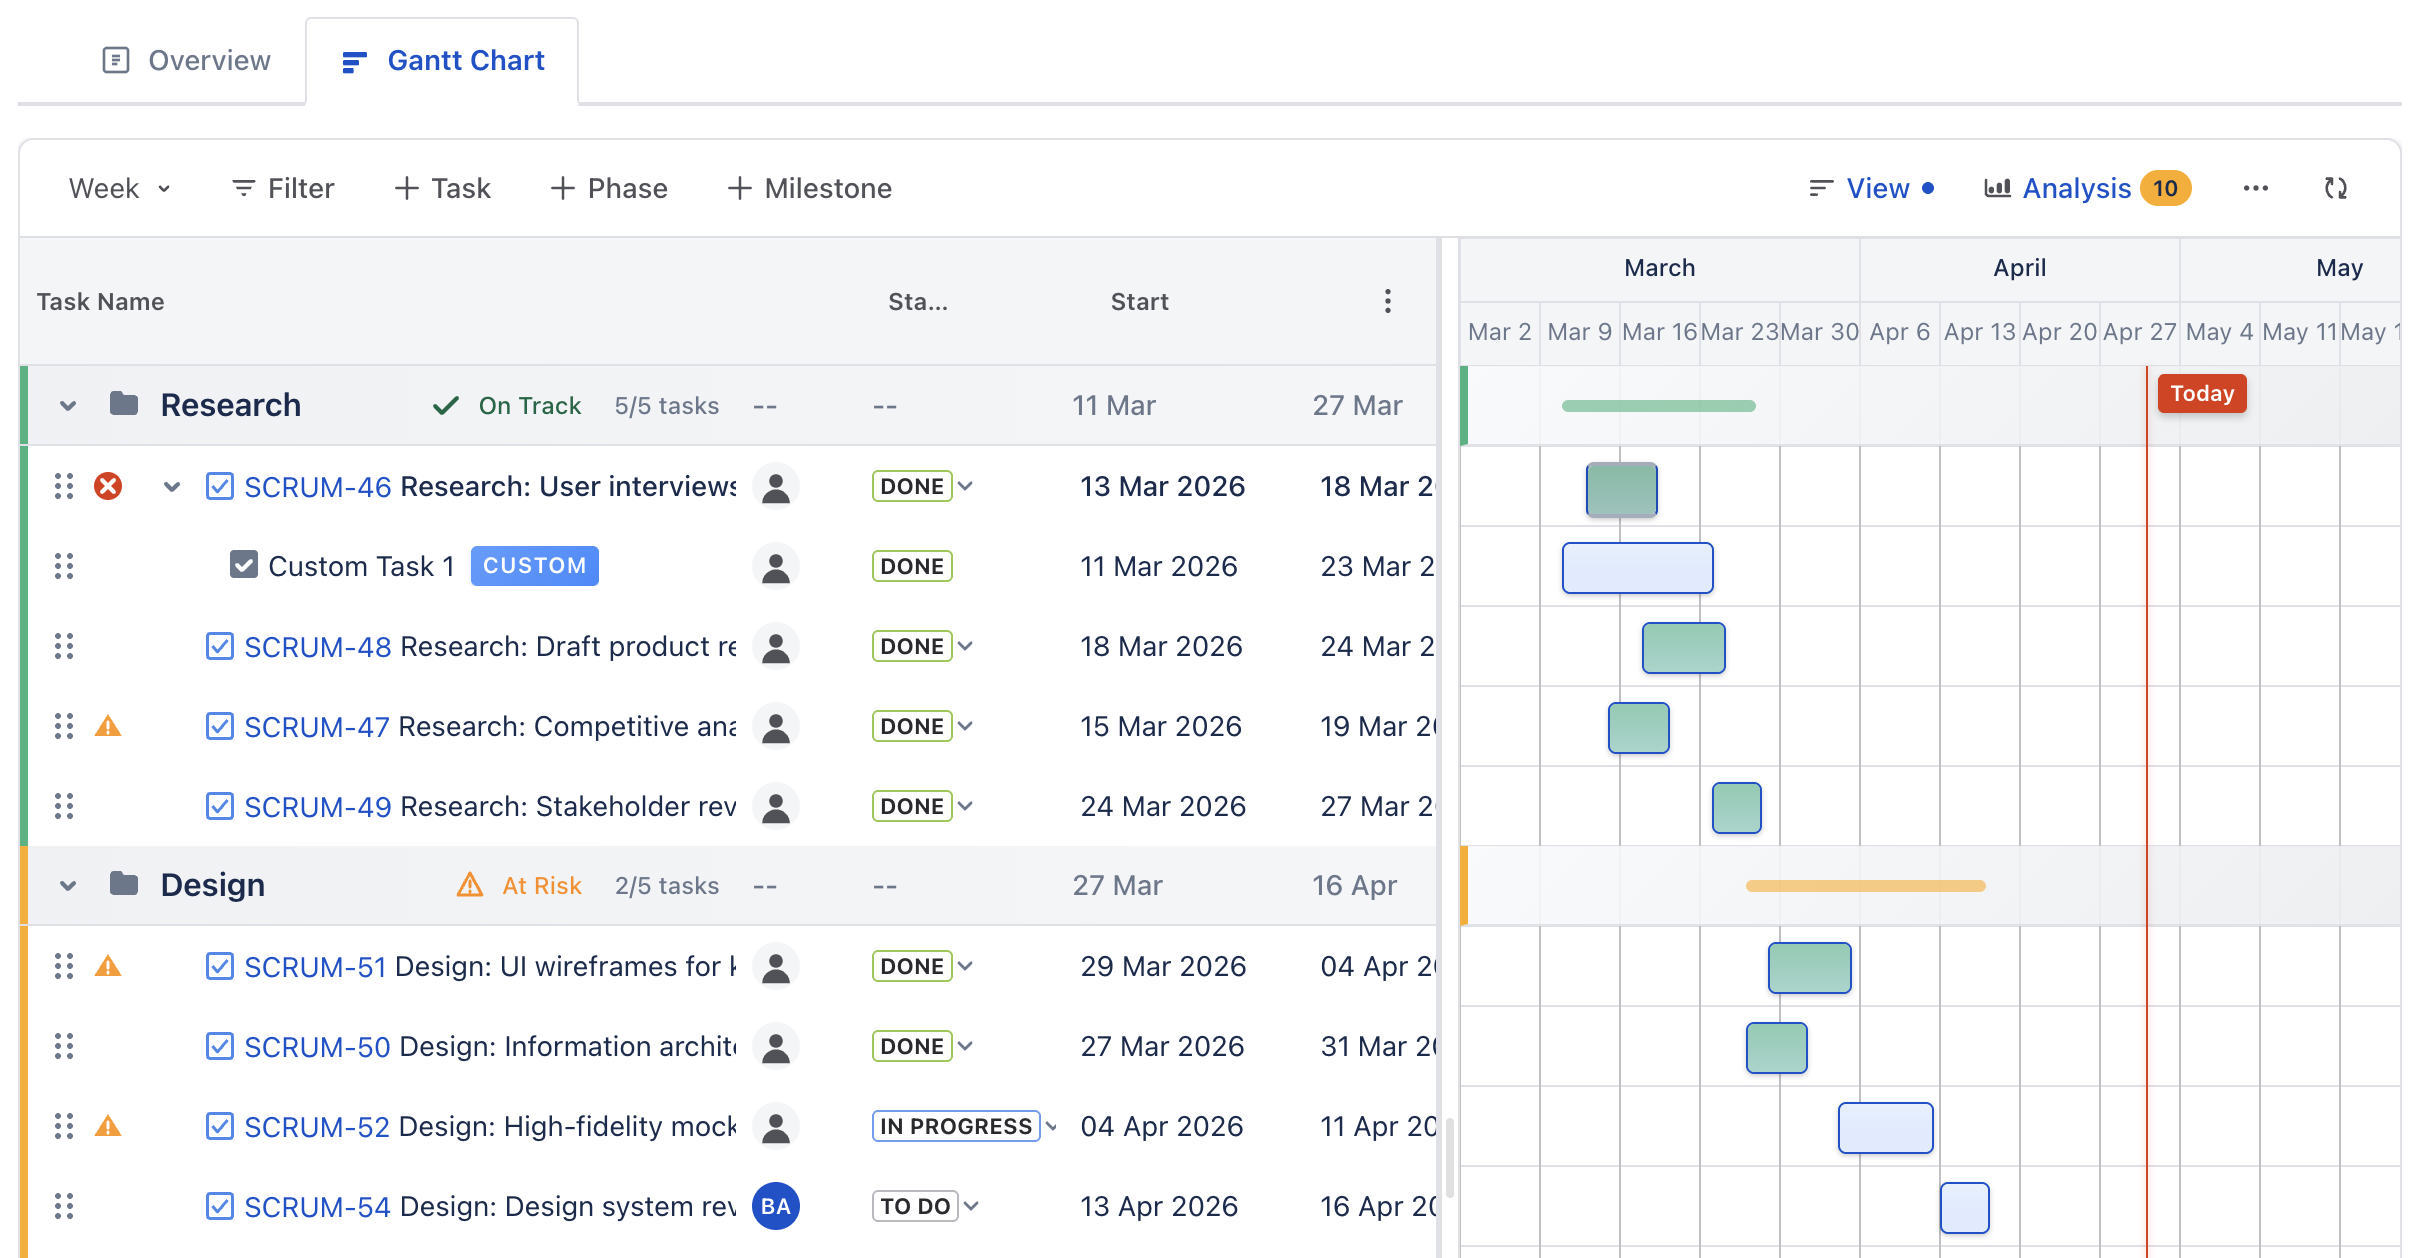
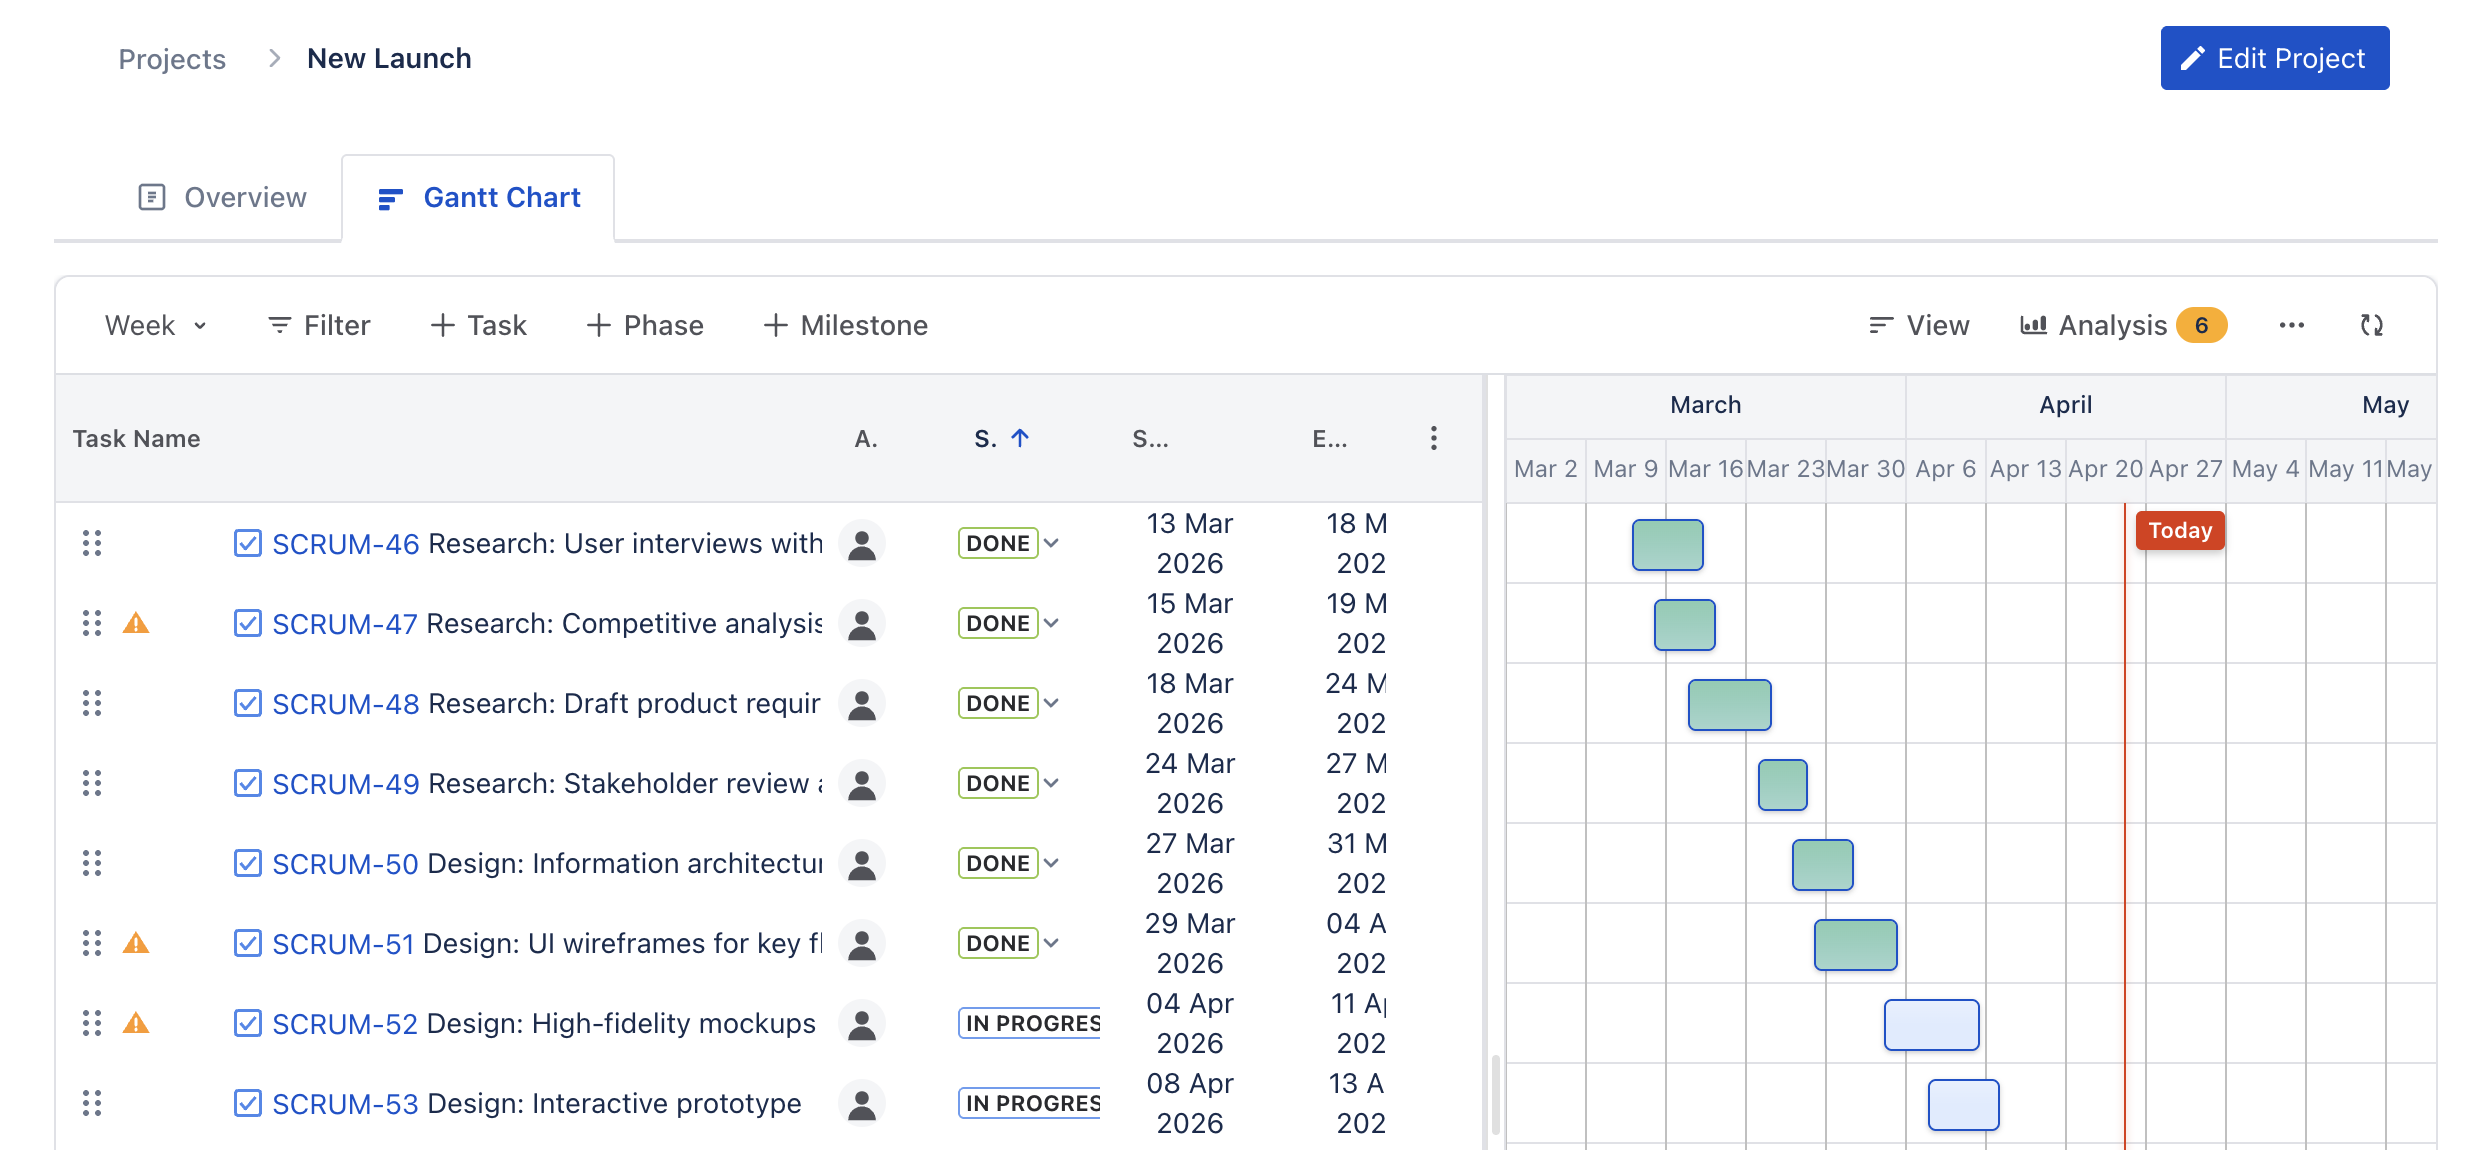
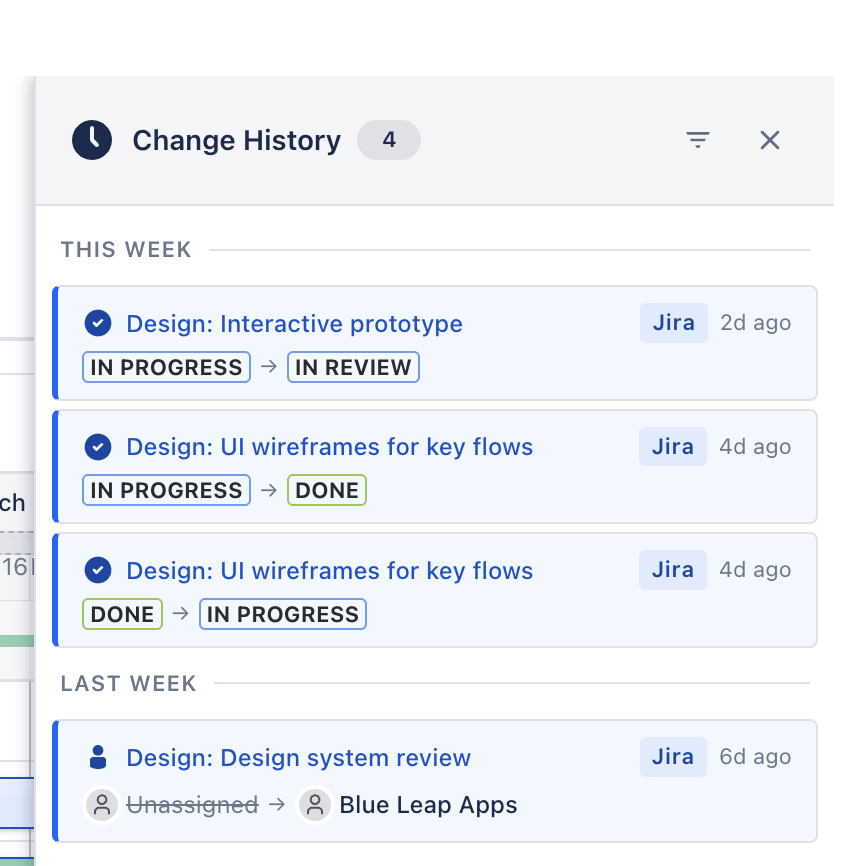
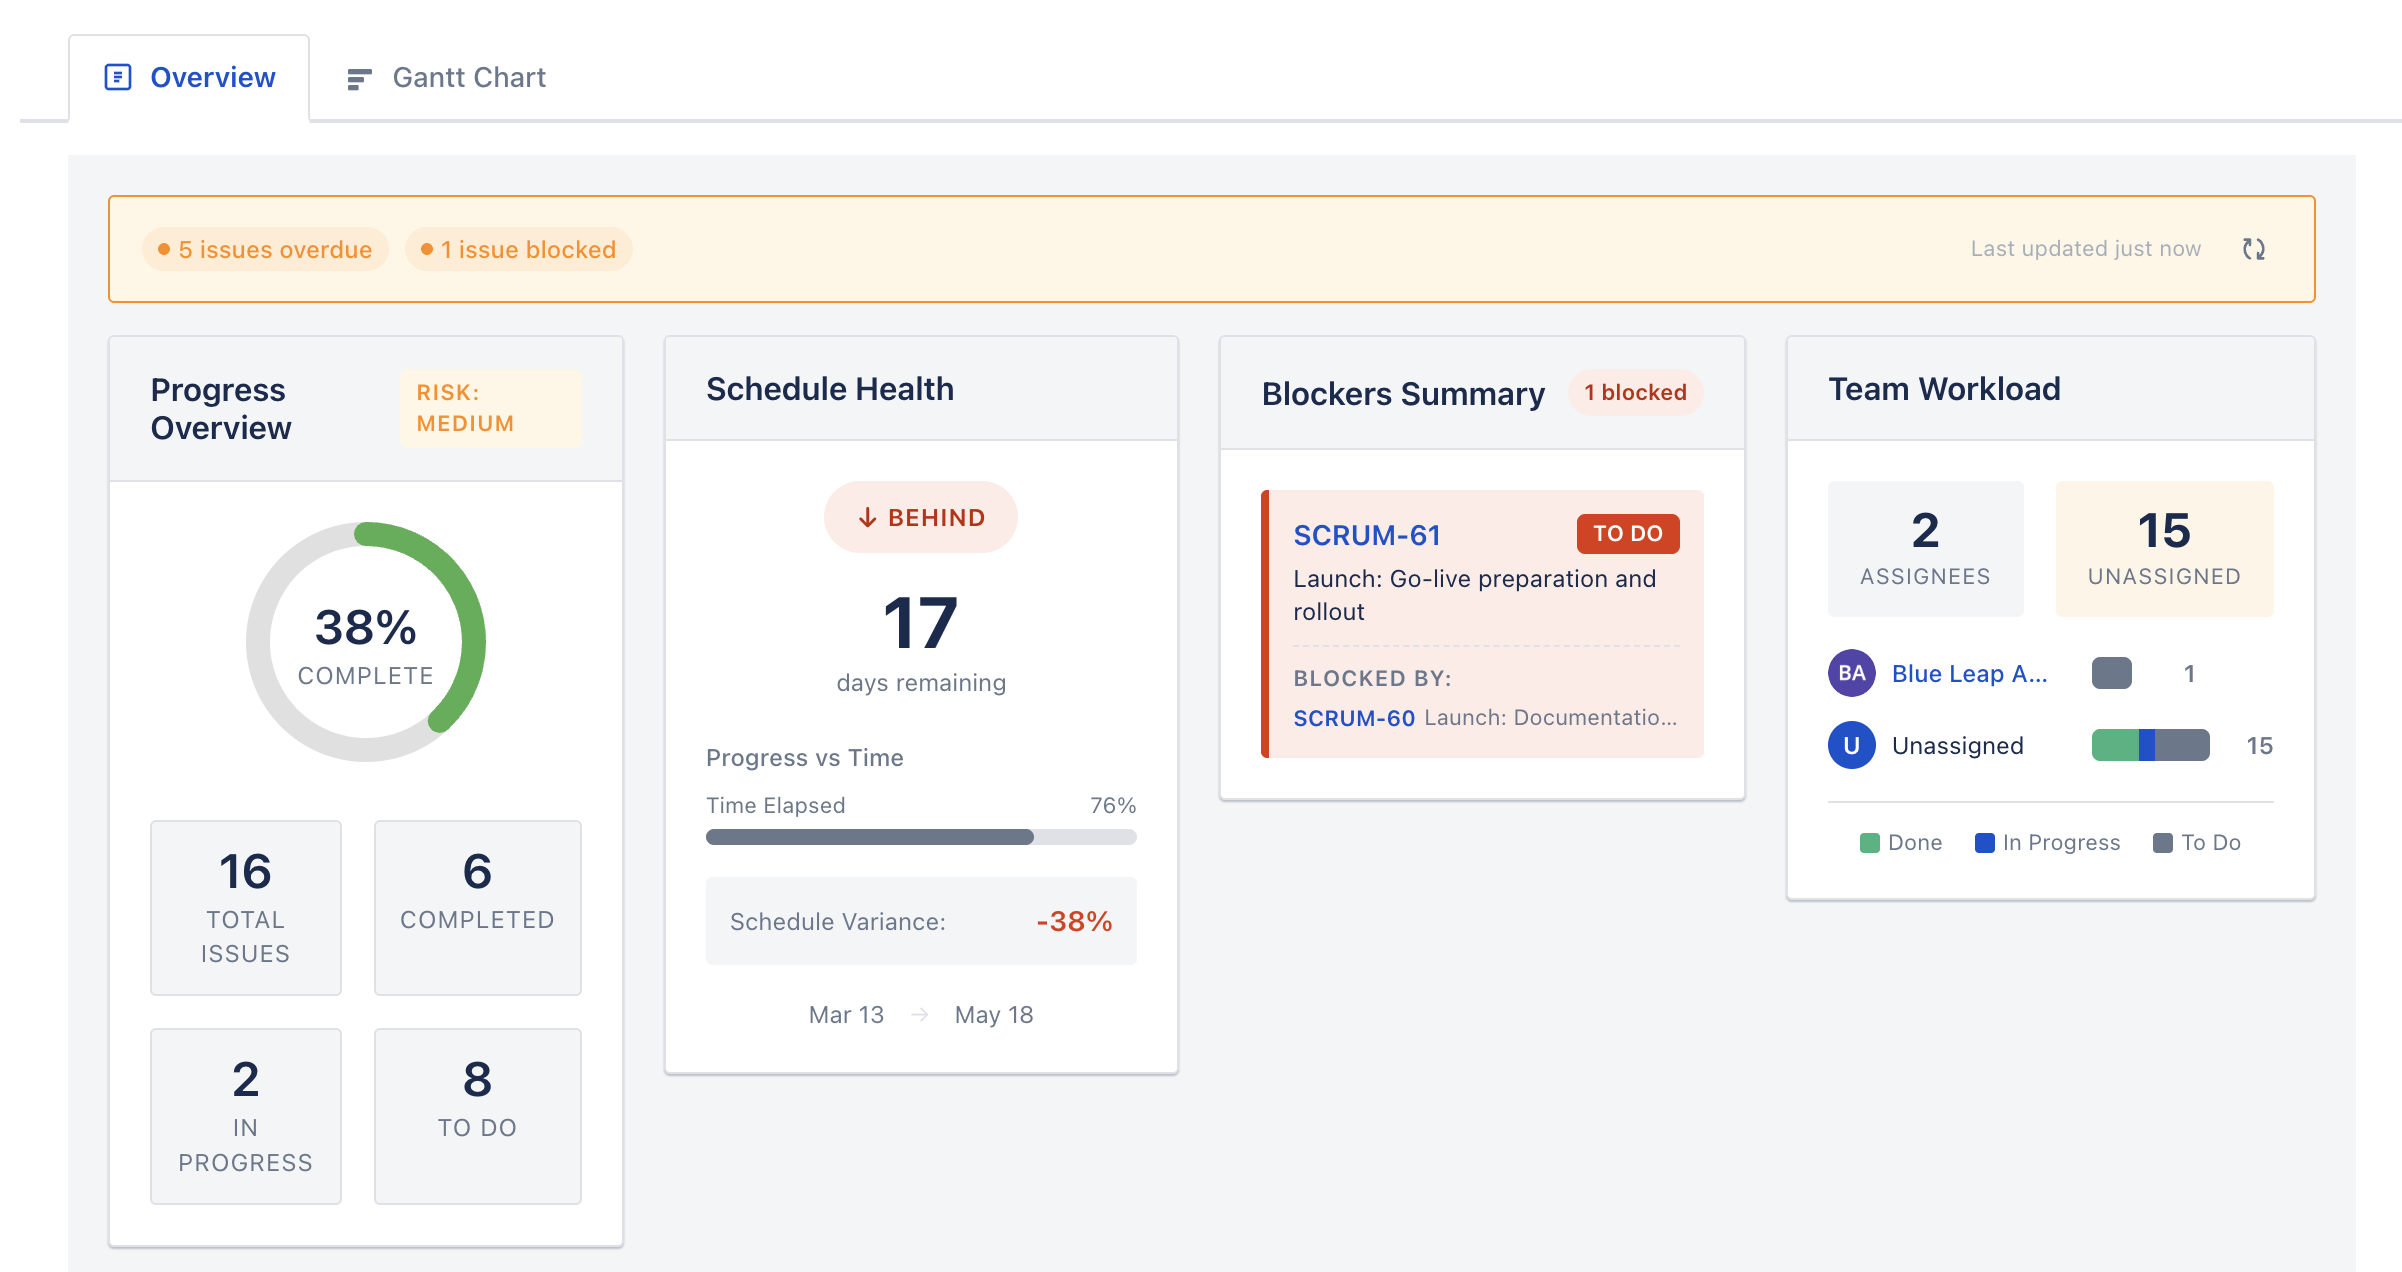
See your entire project. Know exactly where you stand.
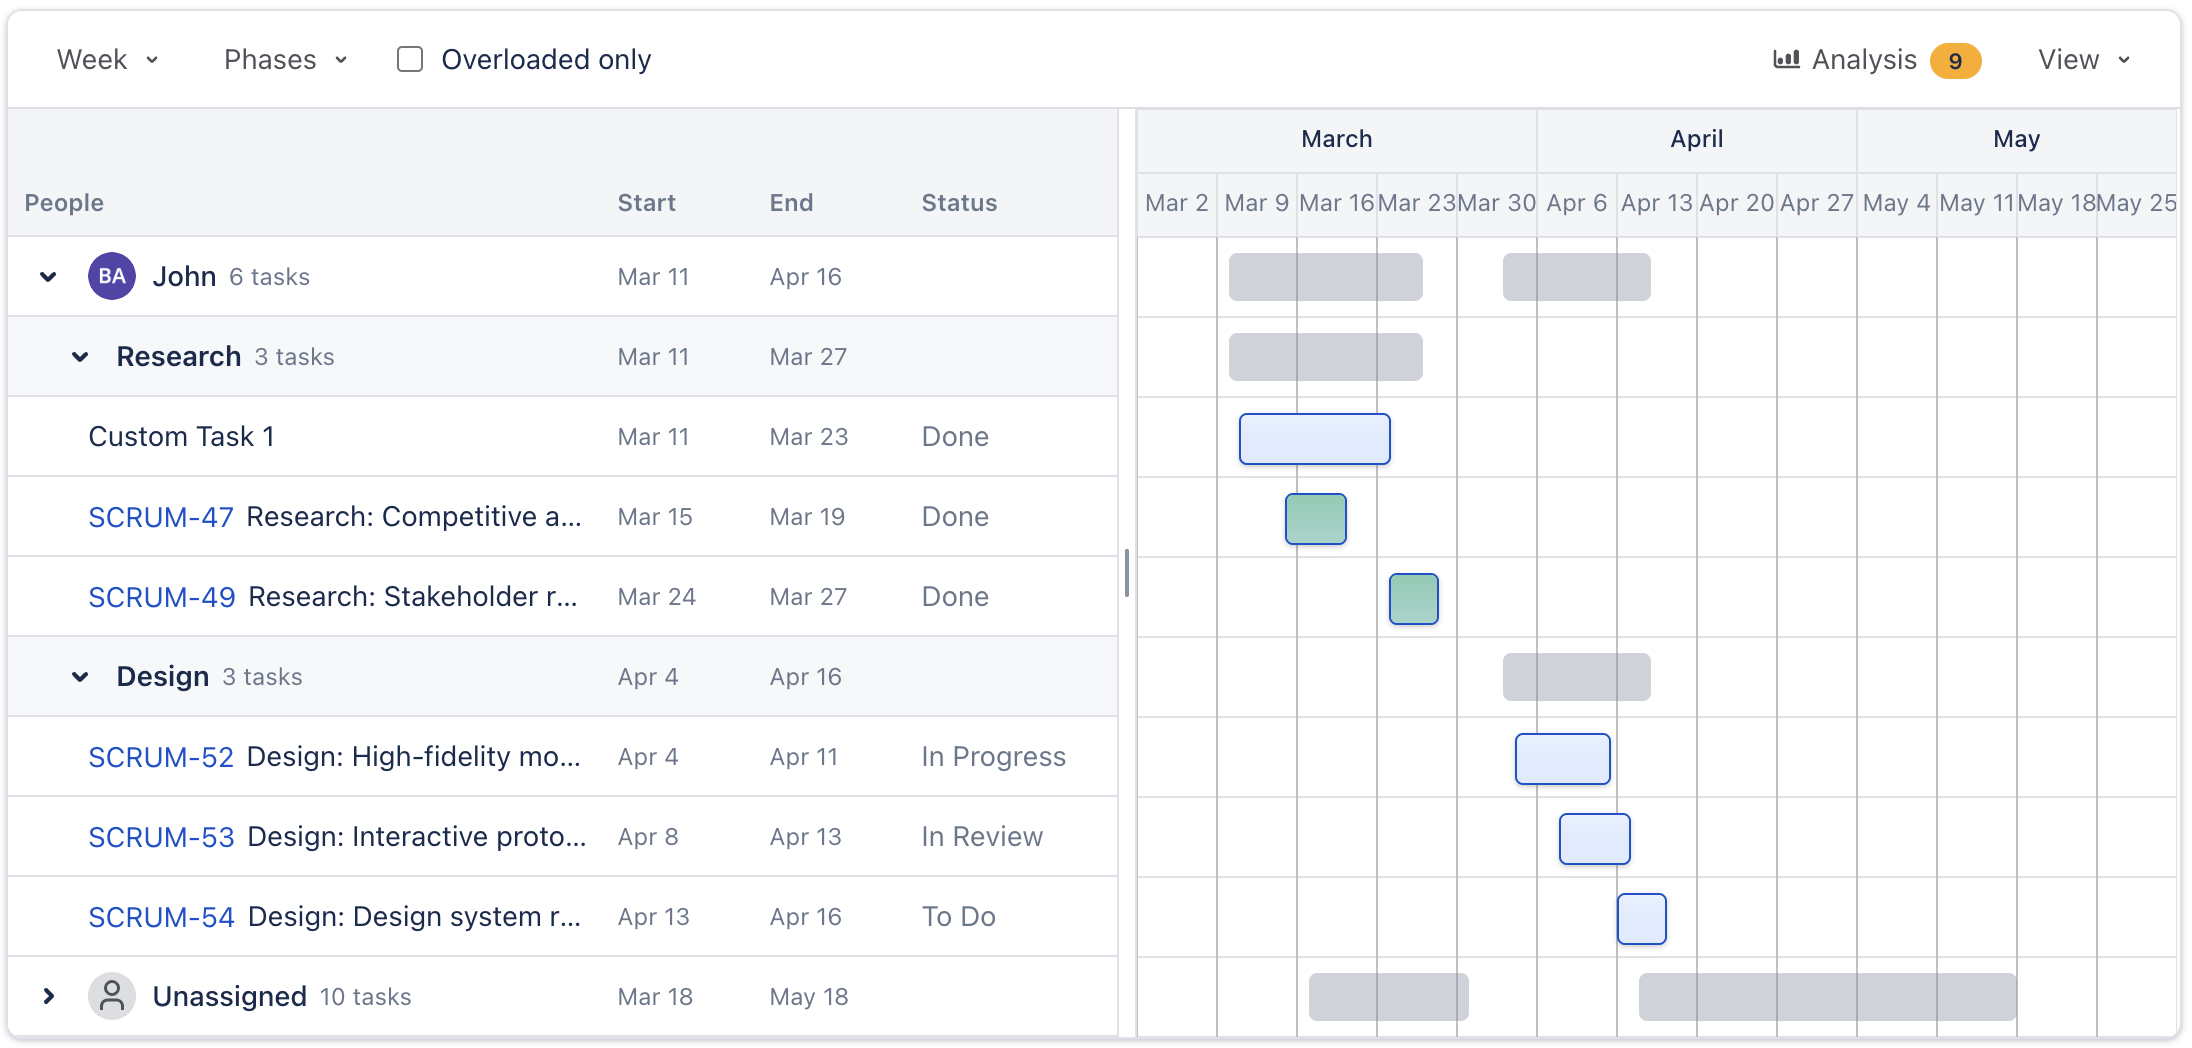
Real Gantt chart project management for Jira Cloud: dependencies, critical path, baselines, sprint overlay, and a health dashboard that tells you if you'll deliver on time. Set up in 60 seconds.
✓ Get started free ✓ Forge-native ✓ No credit card required ✓ Install in 60 seconds