Workload & Resource View
See who's overloaded in Jira — no time estimates required
Simple Gantt's Workload view flips the timeline from "by phase" to "by person." One row per assignee, their tasks on a shared timeline, and an at-a-glance signal when someone has too much on their plate. It works on the data Jira already has: assignees and dates. No story points, no hours, no configuration.
What you get
- ✓ One row per assignee, with every person's work on a shared, zoomable timeline (Day / Week / Month)
- ✓ An overload signal that flags anyone with overlapping work — no estimates or story points needed
- ✓ An Analysis panel that names the exact days each person is over-committed, and which tasks conflict
- ✓ Working-days-only analysis, so weekends never trigger a false "overloaded" flag
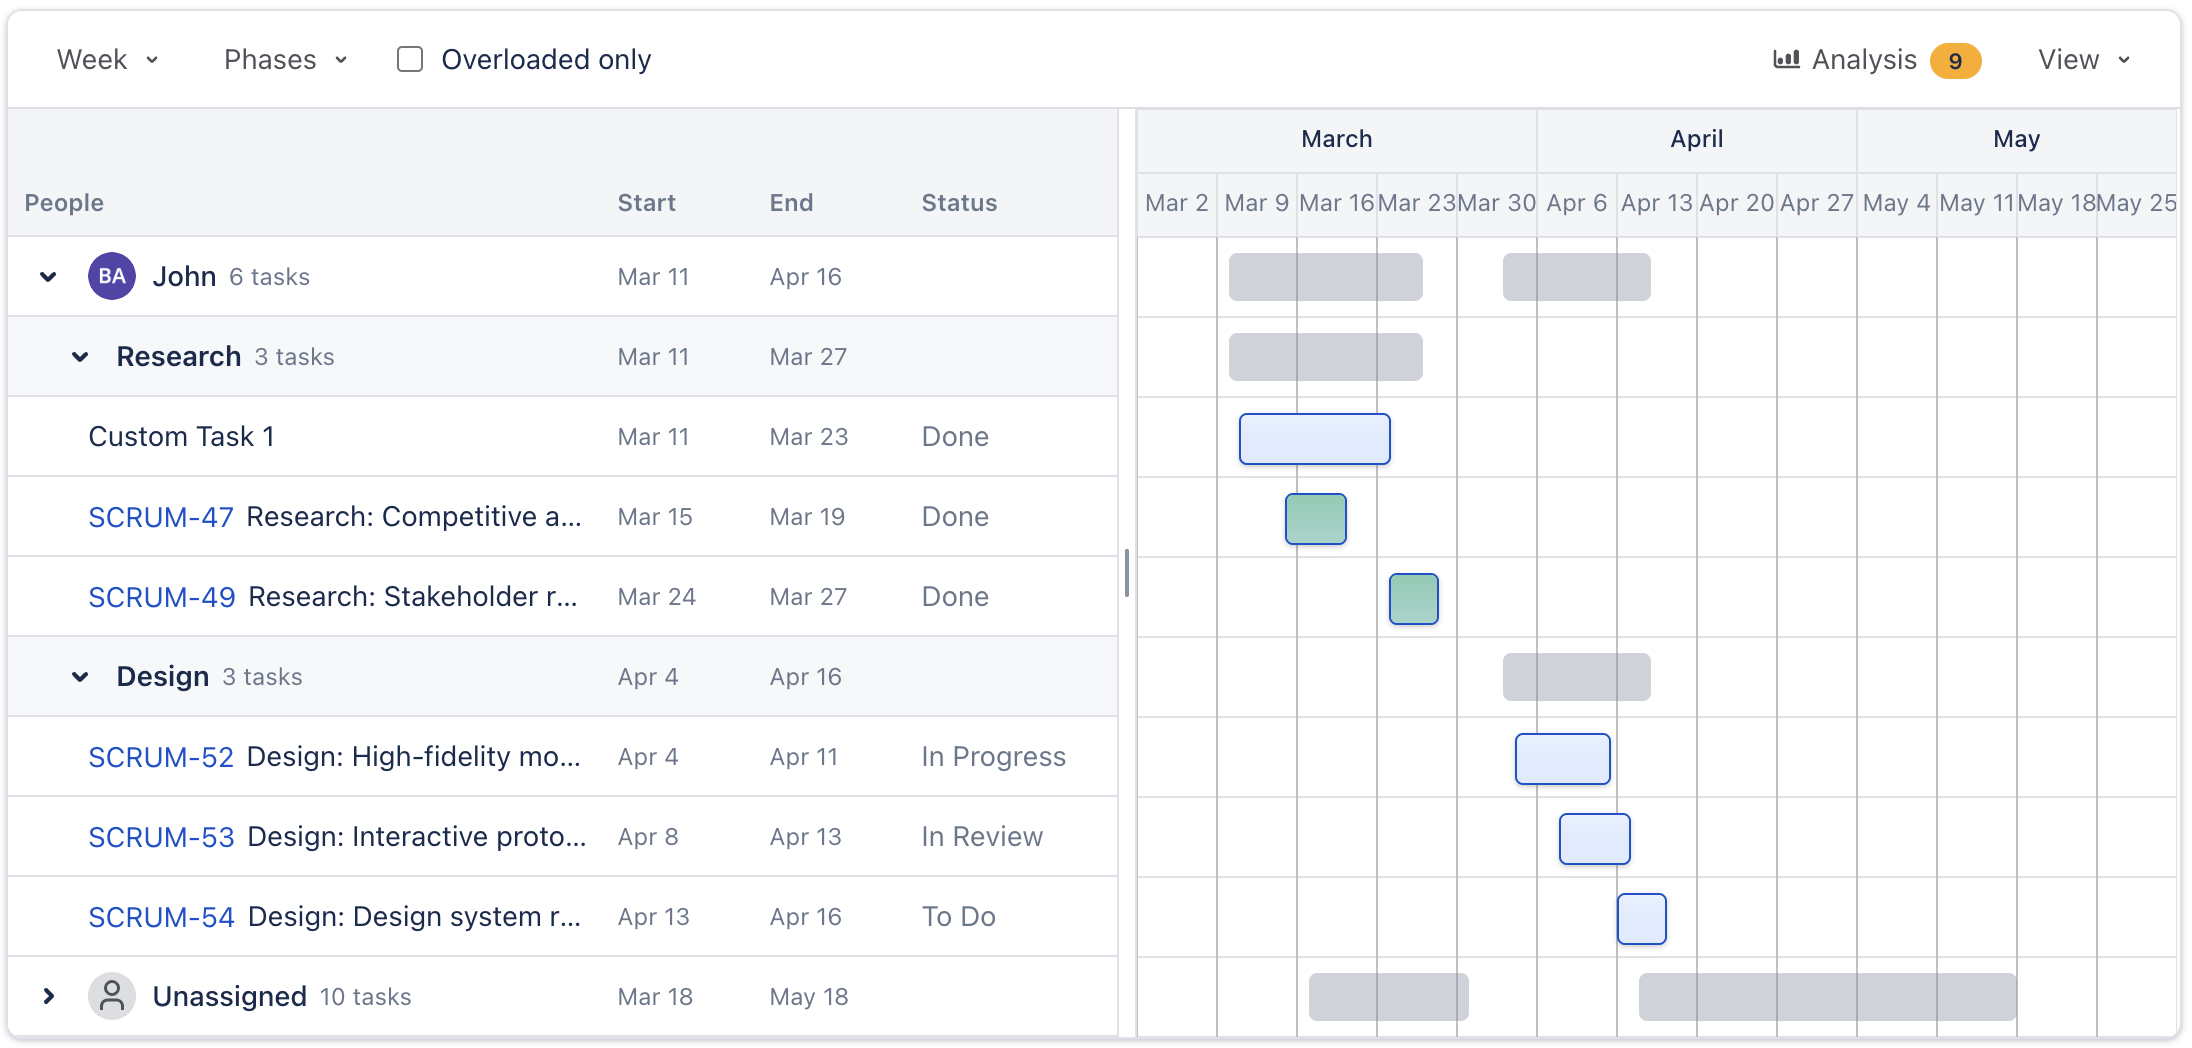
- ✓ Expand any person to see their tasks grouped by phase, with Start / End / Status columns
- ✓ Jump straight from an overloaded person to the task in the Gantt to rebalance
- ✓ Filter to one or more phases, or show overloaded people only
A by-person view of who's working on what
Your Gantt chart answers "what's the plan?" The Workload view answers "who's carrying it?" Flip the timeline to show one row per assignee, with each person's tasks laid out on the same timeline as the Gantt. A roll-up bar summarizes each person's commitment; expand it to see their tasks grouped by phase, each with its start date, end date, and status.
Because it shares the Gantt's timeline, zoom, and Today marker, the Workload view feels like the same chart seen from a different angle, not a separate report you have to learn.
Spot over-commitment at a glance, without estimates
Most resource views in Jira plugins demand a setup tax: log hours or story points on every task before the tool can tell you anything. Simple Gantt takes a different approach. It looks at when each person's tasks overlap on the calendar and flags the people who are stretched across too many things at once. No estimates. No story points. No admin project. It works on the data you already have the moment you open it.
The overload signal is intentionally count-based and read-only. It's built for visibility and quick rebalancing conversations, not for billing or formal capacity planning. That's exactly what most teams need to ask the only question that matters in a standup: "is anyone underwater this week?"
The Analysis panel tells you when, and what's conflicting
Open the Analysis side panel and Simple Gantt lists each over-committed person, the exact date ranges they're stretched, and the conflicting tasks — each shown as the Jira issue key plus its summary, so you can see what's overlapping without opening every ticket. The analysis counts working days only: weekends never create a false positive, and a weekend between two busy days doesn't artificially split a conflict.
From there, one click opens the conflicting task in the Gantt, where you can move dates or reassign work to balance the load, then flip back to Workload to confirm the flag has cleared.
Why this matters
Burnout and slipped deadlines usually start the same way: one person quietly accumulates more concurrent work than anyone notices until it's late. A by-person timeline makes that visible before it becomes a problem. And because it needs zero setup, you'll actually use it every week instead of once a quarter.
Paid Gantt plugins can show resource allocation too, but typically only after your team has diligently estimated every task. Simple Gantt gives you the "who's overloaded?" answer for free, on day one, with the data Jira already captures.
The overload analysis runs on Forge using only the assignees and dates already in Jira. Nothing is exported, and no workload data is processed on an outside server.